Customer Support
The message “The server is temporarily unable to service your request due to maintenance downtime or capacity problems.” is shown on my website. What is going on?
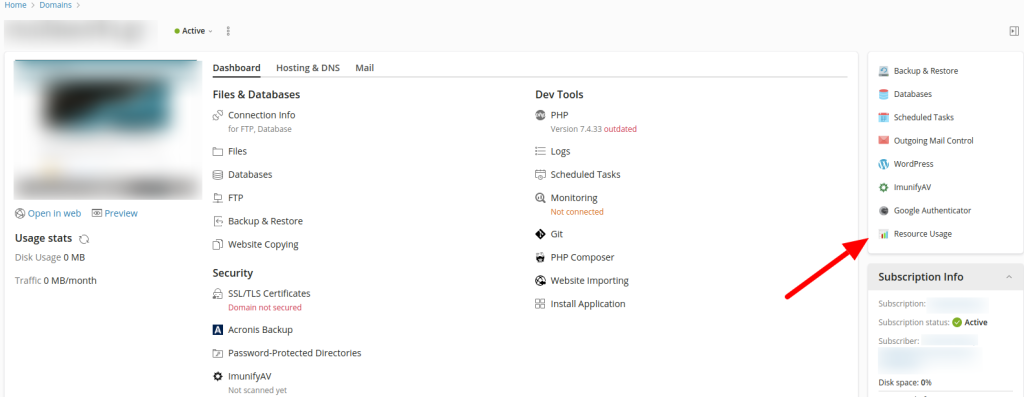
If the browser shows the message The server is temporarily unable to service your request due to maintenance downtime or capacity problems when typing the domain of your website, it’s an indication that your site is currently running out of CPU, RA, and Disk IO resources. Plesk records those data and you can find charts regarding CPU, RAM, and Disk IO. To see what has been recorded, follow the steps below:
- Log in to Plesk.

- In the Websites & Domains tab, choose Resource Usage.

All the information regarding your System User can be found there, as well as a table named Usage. The resource usage per hour is shown in that table. Check the data shown in the "mIO (max Disk IO)” and "lIO (limit Disk IO)” columns. More specifically, take a look at the time frames when both columns have the same value (limits are reached).
Note: If you own a lot of domains, check the ones with the most traffic first.
How can I fix this?
First of all, change the PHP version to the newest possible.
Once you have identified the period that your website reaches the CPU, RAM, and DISK IO limits, find, in the Access Logs, the Requests that run during that same time and try to fix them or even stop them, using the tools described below:
There are some external tools that you can use to optimize the performance of your website.
1. Through your Access Logs check for IPs that cause load to your webpages and are not real traffic, e.g. bots, crawlers, spiders. Once you spot them, block them through the .htaccess file.
2. Although cashing modules that help with speed are already activated in the server, make sure to activate the same modules for the website, since that is one of the most important steps in building a fast website.
3. Visit websites that measure the loading speed of your website and advise you, through reports and charts, about the actions you should take to optimize it. Two of the most popular ones are gtmetrix, where you simply enter the domain name, click Analyze and get optimization reports, and Google’s pagespeed, where you click Run Insights, enter your website, and choose an analysis.
4. You can choose the free cloudflare CDN service, that caches the static files of your website to reduce the data uploaded on the server.
5. Find the repeated errors through your error logs and fix them.
6. Update the application you used to create your website (e.g. WordPress, Joomla), and the themes or plugins you use to the latest version.
You haven't found what you are looking for?
Contact our experts, they will be happy to help!
Contact us